
How to Interpret Your CGM Data
Editor’s note: This guide is meant as a recommendation, not medical advice. CGM data should be reviewed with a provider before making any changes to medications.
Continuous glucose monitoring (CGM) are small, externally worn devices that a lot of people with type 2 diabetes (T2D) are opting to use instead of manually testing their blood sugar levels with a blood glucose meter (BGM).
CGM technology saves lives and has been shown to lower A1C, reduce both high and low blood sugar levels and improve time-in-range (TIR). They help prevent potentially life-threatening short- and long-term diabetes complications, prevent hospitalizations and improve the quality of life for people with diabetes.
Having this life-saving technology is great, but you need to know what all the data means to improve your blood sugar levels and quality of life. Use this guide to learn how!
Trend arrows
Trend arrows are a vital tool as they help indicate not only what your blood sugar is, but where (and the rate at which) it is headed. 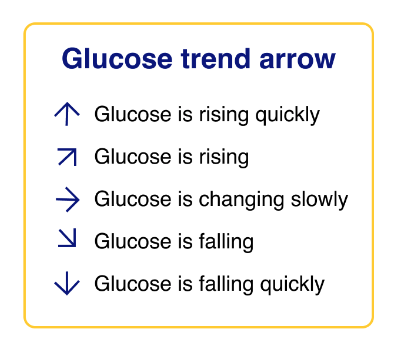
Straight arrow
A straight across arrow means that your blood sugar levels are steady or changing slowly. They are not rising or falling, so whatever you’re doing is keeping your levels steady! Great job!
Up arrow
Any up arrows indicate that you may need to either take medication, drink water or typically do some sort of physical activity to help steady blood sugar levels and start to bring them down.
- An arrow up and to the right indicates that blood sugar levels are slowly rising
- A straight up arrow indicates that blood sugar levels are quickly rising
Some CGMs may also show a double straight up arrow to indicate quickly rising blood sugar levels.
Down arrow
A down arrow is something to keep your eye on to make sure your blood sugar level doesn’t drop too much or too quickly.
- An arrow pointed down and to the right indicates that your blood sugar levels are slowly falling
- A straight down arrow indicates that blood sugar levels are dropping quickly A double arrow down indicates that blood sugar levels are dropping quickly, at a rate of more than 3 mg/dL per minute or more than 90 mg/dL within 30 minutes.
Some CGMs may also show a double straight down arrow to indicate quickly rising blood sugar levels. Rapidly falling blood sugar levels can be extremely dangerous if you do not treat it with glucose or fast-acting sugar quickly, especially if your number is not exceedingly high.
If there is no arrow, it means that the system cannot calculate the velocity or direction of the blood sugar level change.
Patterns
Patterns are something that the CGM system can detect on its own! 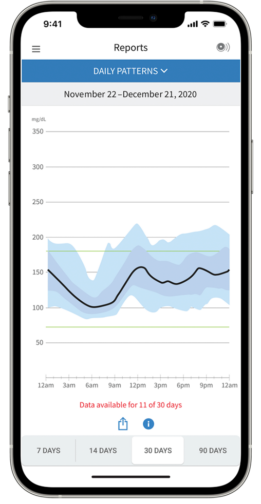
For example, the Freestyle LibreLink App can help you automatically track daily and weekly patterns by generating pattern reports to help fine-tune your diabetes management even more.
This daily patterns graph shows the variability of blood sugar levels over multiple hours and days. The thick black line shows the midpoint of your glucose readings.
Learning what your patterns are can help you modify foods, medications, and exercise to help prevent high and low blood sugar levels before they even occur!
In this example graph, it looks like there’s a pattern of blood sugar levels rising every day after 9am. Interpreting this graph would help you decide if your breakfast or morning medications might need to be adjusted.
The Freestyle Libre CGM measures blood sugar levels every minute—1,440 readings per day! Daily Patterns needs at least 5 days of data but if there is a pattern, the system will be sure to catch it.
Time in range
Time in range (TIR) is one of the most powerful metrics for modern diabetes management, as A1C levels can give a false sense of success and can hide a lot of both high and low blood sugar levels.
TIR is a way of measuring the percentage of time in a given day a person is staying within a recommended blood sugar target range. The standard range is between 3.885 mmol/l70–9.99 mmol/l180 mg/dL but your target range should always be individualized between you and your doctor.
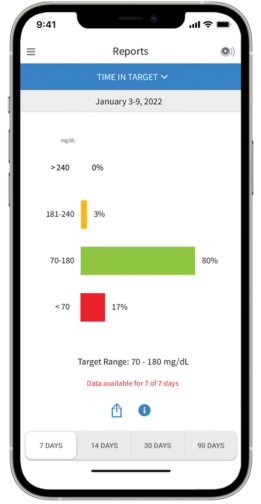
The Freestyle LibreLink App tracks this as time in target (shown in image) and generates daily and weekly reports to see how much time your blood sugar levels have been within your target range.
Many experts recommend aiming for a TIR of at least 50%, with low blood sugars occurring less than 5% of the day.
Some simple ways to help improve your TIR include:
- Staying hydrated with water
- Eating regular meals
- Getting daily movement/exercise
- Getting between seven to nine hours of sleep per night
- Bolusing before meals (if you’re on insulin)
- Managing stress with breathing exercises, meditation, journaling, and yoga
Discussing data with your doctor
It is always important to go over your CGM data with your doctor, especially if you have questions. Before you make substantial changes to your therapy or diabetes management tactics, reviewing your CGM data can be helpful to know exactly where changes may be needed.
It is important not to over-analyze CGM data before speaking with your doctor, especially if you see blood sugar level spikes after you eat or drop after exercise. Checking your CGM data too much can contribute to anxiety and diabetes burnout. Remember all the numbers and data you see don’t define your worth!
CGM technology isn’t a cure-all
CGM technology can be a critical addition to your diabetes tool belt, but know that it won’t solve all of your diabetes woes.
Habits like daily movement, eating nutritionally-balanced meals, getting enough sleep, adjusting your medications as needed and managing stress are also crucial components of living a healthy life with T2D.
CGM technology and interpreting the data correctly can empower you to make better management decisions along the way.
Editor’s Note: Educational content for newly diagnosed people with diabetes is made possible with support from Abbott, makers of the Freestyle Libre 3 system, a founding partner of Beyond Type 2. Editorial control rests solely with Beyond Type 2.